Show the code
pacman::p_load(sf, tmap, tidyverse)pacman::p_load(sf, tmap, tidyverse)not required to add file extension
mpsz <- st_read(dsn = "data/Hands-on_Ex08/geospatial",
                layer = "MP14_SUBZONE_WEB_PL")
Reading layer `MP14_SUBZONE_WEB_PL' from data source
`C:\MITB\noye09\ISSS608_AY2022-23_April_YeNaingOo\data\Hands-on_Ex08\geospatial'
using driver `ESRI Shapefile'
Simple feature collection with 323 features and 15 fields
Geometry type: MULTIPOLYGON
Dimension: XY
Bounding box: xmin: 2667.538 ymin: 15748.72 xmax: 56396.44 ymax: 50256.33
Projected CRS: SVY21check the content
mpszSimple feature collection with 323 features and 15 fields
Geometry type: MULTIPOLYGON
Dimension: XY
Bounding box: xmin: 2667.538 ymin: 15748.72 xmax: 56396.44 ymax: 50256.33
Projected CRS: SVY21
First 10 features:
OBJECTID SUBZONE_NO SUBZONE_N SUBZONE_C CA_IND PLN_AREA_N
1 1 1 MARINA SOUTH MSSZ01 Y MARINA SOUTH
2 2 1 PEARL'S HILL OTSZ01 Y OUTRAM
3 3 3 BOAT QUAY SRSZ03 Y SINGAPORE RIVER
4 4 8 HENDERSON HILL BMSZ08 N BUKIT MERAH
5 5 3 REDHILL BMSZ03 N BUKIT MERAH
6 6 7 ALEXANDRA HILL BMSZ07 N BUKIT MERAH
7 7 9 BUKIT HO SWEE BMSZ09 N BUKIT MERAH
8 8 2 CLARKE QUAY SRSZ02 Y SINGAPORE RIVER
9 9 13 PASIR PANJANG 1 QTSZ13 N QUEENSTOWN
10 10 7 QUEENSWAY QTSZ07 N QUEENSTOWN
PLN_AREA_C REGION_N REGION_C INC_CRC FMEL_UPD_D X_ADDR
1 MS CENTRAL REGION CR 5ED7EB253F99252E 2014-12-05 31595.84
2 OT CENTRAL REGION CR 8C7149B9EB32EEFC 2014-12-05 28679.06
3 SR CENTRAL REGION CR C35FEFF02B13E0E5 2014-12-05 29654.96
4 BM CENTRAL REGION CR 3775D82C5DDBEFBD 2014-12-05 26782.83
5 BM CENTRAL REGION CR 85D9ABEF0A40678F 2014-12-05 26201.96
6 BM CENTRAL REGION CR 9D286521EF5E3B59 2014-12-05 25358.82
7 BM CENTRAL REGION CR 7839A8577144EFE2 2014-12-05 27680.06
8 SR CENTRAL REGION CR 48661DC0FBA09F7A 2014-12-05 29253.21
9 QT CENTRAL REGION CR 1F721290C421BFAB 2014-12-05 22077.34
10 QT CENTRAL REGION CR 3580D2AFFBEE914C 2014-12-05 24168.31
Y_ADDR SHAPE_Leng SHAPE_Area geometry
1 29220.19 5267.381 1630379.3 MULTIPOLYGON (((31495.56 30...
2 29782.05 3506.107 559816.2 MULTIPOLYGON (((29092.28 30...
3 29974.66 1740.926 160807.5 MULTIPOLYGON (((29932.33 29...
4 29933.77 3313.625 595428.9 MULTIPOLYGON (((27131.28 30...
5 30005.70 2825.594 387429.4 MULTIPOLYGON (((26451.03 30...
6 29991.38 4428.913 1030378.8 MULTIPOLYGON (((25899.7 297...
7 30230.86 3275.312 551732.0 MULTIPOLYGON (((27746.95 30...
8 30222.86 2208.619 290184.7 MULTIPOLYGON (((29351.26 29...
9 29893.78 6571.323 1084792.3 MULTIPOLYGON (((20996.49 30...
10 30104.18 3454.239 631644.3 MULTIPOLYGON (((24472.11 29...popdata <- read_csv("data/Hands-on_Ex08/aspatial/respopagesextod2011to2020.csv")Rows: 984656 Columns: 7
── Column specification ────────────────────────────────────────────────────────
Delimiter: ","
chr (5): PA, SZ, AG, Sex, TOD
dbl (2): Pop, Time
ℹ Use `spec()` to retrieve the full column specification for this data.
ℹ Specify the column types or set `show_col_types = FALSE` to quiet this message.# Filter the dataset for Time == 2020
popdata2020 <- popdata %>%
filter(Time == 2020) %>%
# Group the data by PA, SZ, and AG
group_by(PA, SZ, AG) %>%
# Summarize the Pop column within each group and rename it as POP
summarise(`POP` = sum(`Pop`)) %>%
# Remove the grouping
ungroup() %>%
# Pivot the data wider, with AG as column names and POP as values
pivot_wider(names_from = AG, values_from = POP) %>%
# Calculate the sum of values in columns 3 to 6 and column 12,
# and assign it to the column YOUNG
mutate(YOUNG = rowSums(.[3:6]) + rowSums(.[12])) %>%
# Calculate the sum of values in columns 7 to 11 and columns 13 to 15,
# and assign it to the column ECONOMY ACTIVE
mutate(`ECONOMY ACTIVE` = rowSums(.[7:11]) + rowSums(.[13:15])) %>%
# Calculate the sum of values in columns 16 to 21 and assign it to the column AGED
mutate(`AGED` = rowSums(.[16:21])) %>%
# Calculate the sum of values in columns 3 to 21 and assign it to the column TOTAL
mutate(`TOTAL` = rowSums(.[3:21])) %>%
# Calculate the dependency ratio by dividing the sum of YOUNG and AGED by ECONOMY ACTIVE
mutate(`DEPENDENCY` = (`YOUNG` + `AGED`) / `ECONOMY ACTIVE`) %>%
# Select specific columns for the final output
select(`PA`, `SZ`, `YOUNG`, `ECONOMY ACTIVE`, `AGED`, `TOTAL`, `DEPENDENCY`)`summarise()` has grouped output by 'PA', 'SZ'. You can override using the
`.groups` argument.simple feature data frame table must be on the left
popdata2020 <- popdata2020 %>%
  mutate_at(.vars = vars(PA, SZ),
          .funs = funs(toupper)) %>%
  filter(`ECONOMY ACTIVE` > 0)
Warning: `funs()` was deprecated in dplyr 0.8.0.
ℹ Please use a list of either functions or lambdas:
# Simple named list: list(mean = mean, median = median)
# Auto named with `tibble::lst()`: tibble::lst(mean, median)
# Using lambdas list(~ mean(., trim = .2), ~ median(., na.rm = TRUE))mpsz_pop2020 <- left_join(mpsz, popdata2020,
by = c("SUBZONE_N" = "SZ"))tmap_mode("plot")tmap mode set to plottingqtm(mpsz_pop2020,
fill = "DEPENDENCY")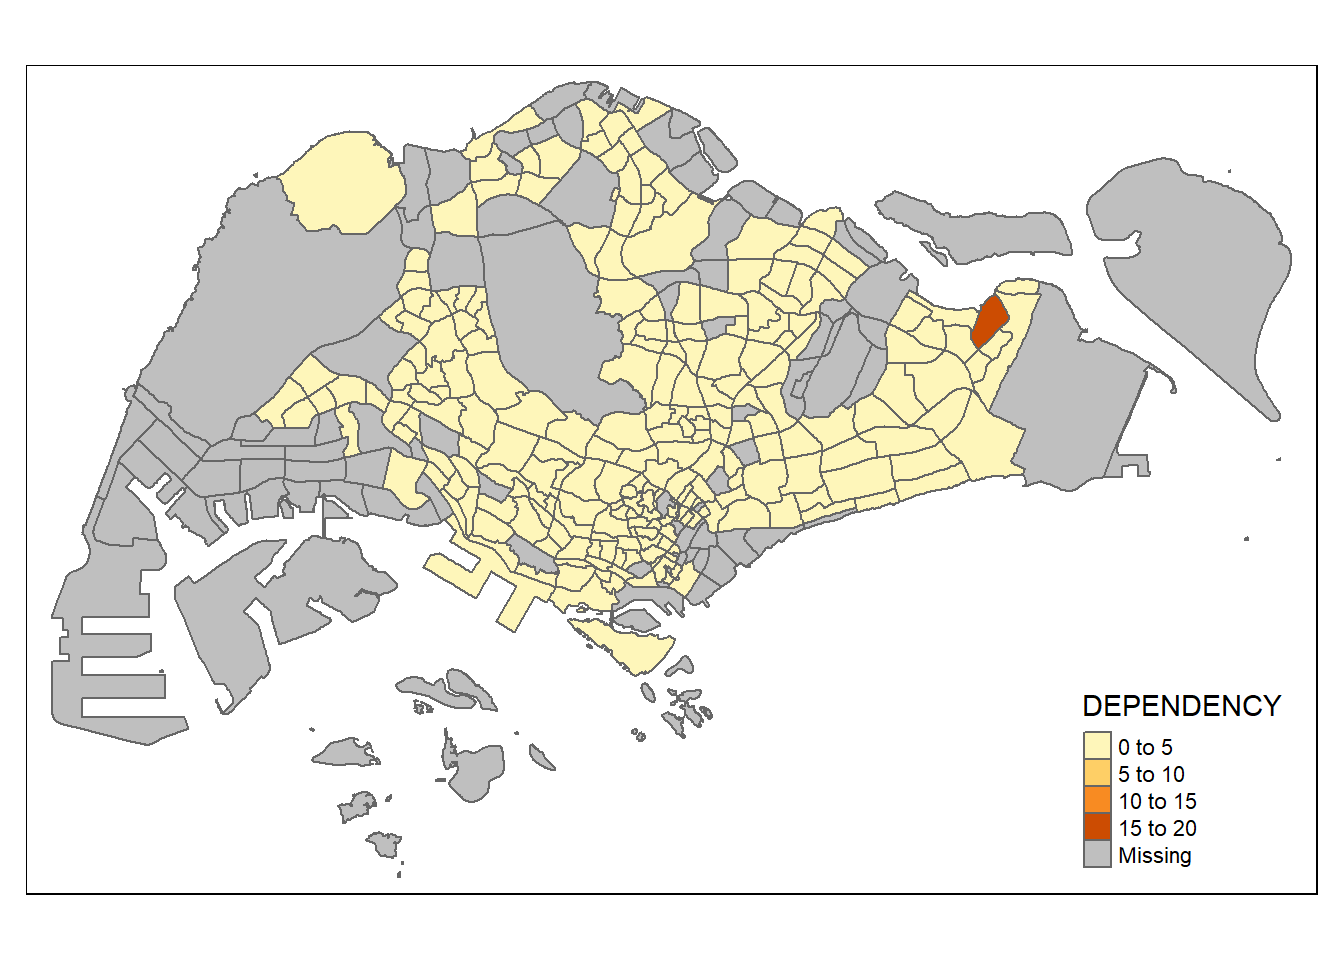
tm_shape(mpsz_pop2020)+
  tm_fill("DEPENDENCY",
          n = 6,
          style = "quantile",
          palette = "Blues") +
  tm_borders(alpha = 0.5)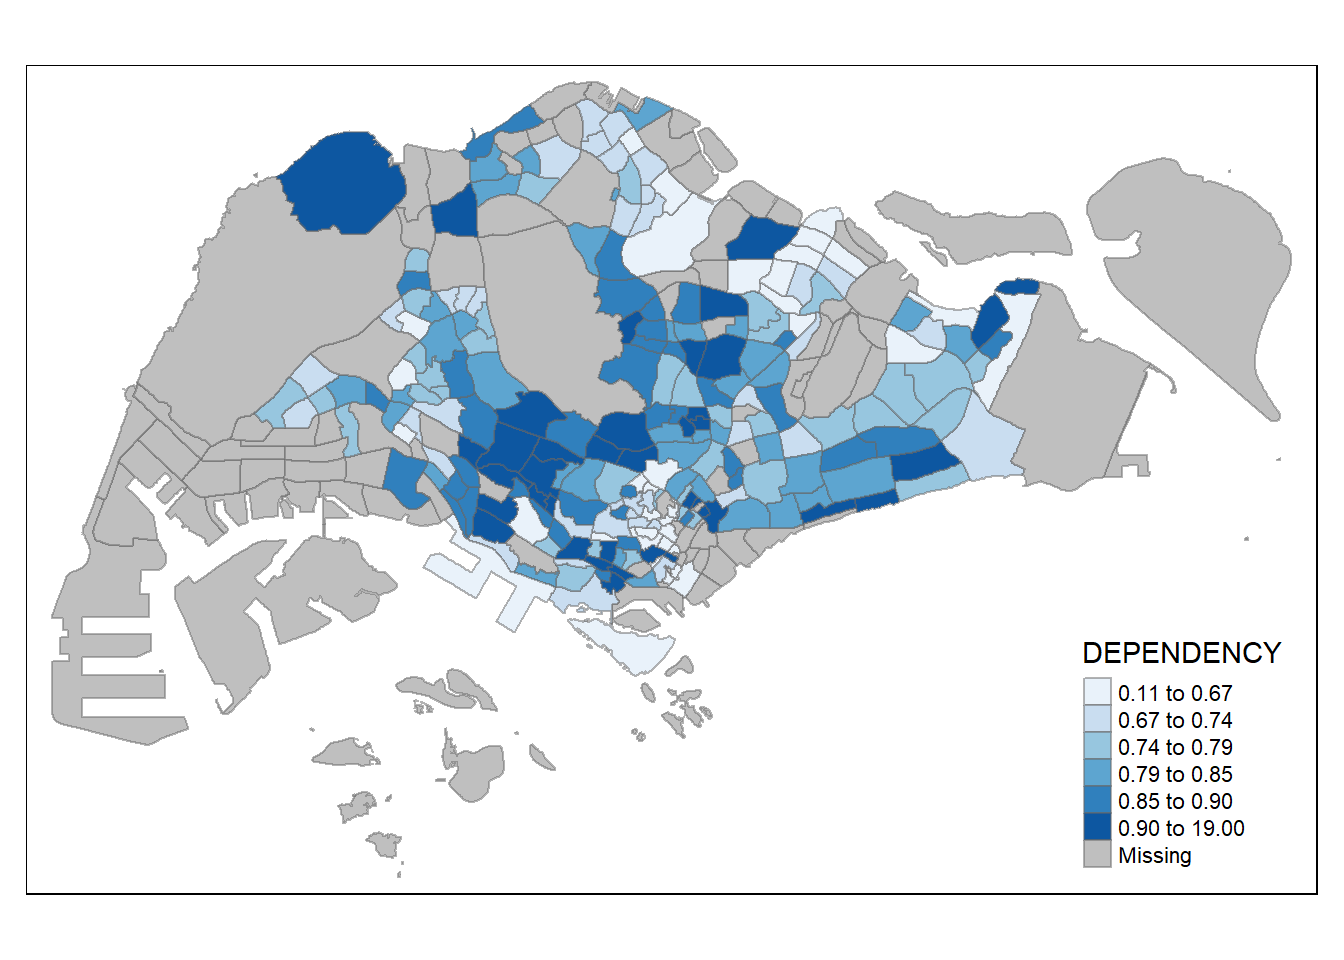
===================================================================================
sgpools <- read_csv("data/Hands-on_Ex08/aspatial/SGPools_svy21.csv")Rows: 306 Columns: 7
── Column specification ────────────────────────────────────────────────────────
Delimiter: ","
chr (3): NAME, ADDRESS, OUTLET TYPE
dbl (4): POSTCODE, XCOORD, YCOORD, Gp1Gp2 Winnings
ℹ Use `spec()` to retrieve the full column specification for this data.
ℹ Specify the column types or set `show_col_types = FALSE` to quiet this message.sgpools_sf <- st_as_sf(sgpools, coords = c("XCOORD","YCOORD"), crs = 3414)tmap_mode("view")tmap mode set to interactive viewingtm_shape(sgpools_sf)+
tm_bubbles(col = "red",
size = 1,
border.col = "black",
border.lwd = 1)tm_shape(sgpools_sf)+
tm_bubbles(col = "red",
size = "Gp1Gp2 Winnings",
border.col = "black",
border.lwd = 1)Legend for symbol sizes not available in view mode.tm_shape(sgpools_sf)+
tm_bubbles(col = "OUTLET TYPE",
size = "Gp1Gp2 Winnings",
border.col = "black",
border.lwd = 1)Legend for symbol sizes not available in view mode.tm_shape(sgpools_sf) +
tm_bubbles(col = "OUTLET TYPE",
size = "Gp1Gp2 Winnings",
border.col = "black",
border.lwd = 1) +
tm_facets(by= "OUTLET TYPE",
nrow = 1,
sync = TRUE)Legend for symbol sizes not available in view mode.